Introduction to FLVisualize
FLVisualize is the main detector/event viewer GUI for Falaise, and can display both raw and reconstructed data for the BiPo3 and Demonstrator detectors. It can be used to view:
- Raw detector geometries,
- Raw/Calibrated data from flsimulate,
- Reconstructed tracks and calorimetry.
Here we present a brief overview of running FLVisualize from the command line.
Example Usage
The flvisualize program is a command line application just like any other Unix style program (e.g. ls). In the following, we will write commands assuming that flvisualize is in your path. If it is not, simply use the relative or absolute path to flvisualize.
You can get help on the options that can be passed to flvisualize by running it with the -h or --help options, e.g.
If no command line arguments are passed, then flvisualize will start up and display the SuperNEMO demonstrator default geometry model (tag=`"urn:snemo:demonstrator:setup:1.0"̀ with its default variant profile):
To visualize a data file output by the flsimulate or flreconstruct applications, you need to supply the input file:
If metadata are embedded in the input data file, they are extracted from it and FLSimulate tries to guess the experimental setup and the associated geometry model it should use in combinaison with the data. If an explicit variant profile has been used to configure the geometry, it must be given in the command line because once started, FLSimulate (in its current version) cannot switch to another geometry model on the fly. In such case, the recommended way to invoke flvisualize is to explicitely describe the geometry setup from the command line:
If metadata are only provided from an external file, you should use:
If external metadata and a non registered variant profile should be used (no registered official tag is supported for it), you should use:
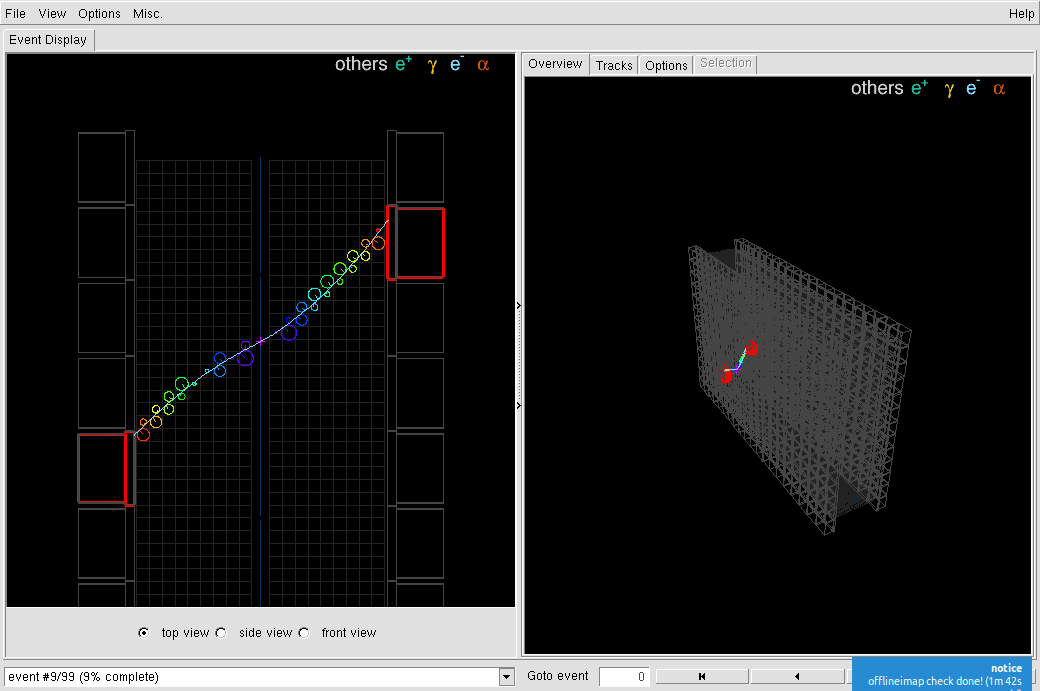
The program displays its main window with a two panels event viewer. The image below shows a Tl-208 decays from a field wire in the tracking volume with emission of one electron and three gamma rays. On the left panel, the Focus on ROI option is activated (see below).
Files may also be opened using the "File->Open file..." GUI menu item. In this case, the experimental setup (geometry) and variant profile should have been set at start from the command line as shown above.
Description of the display
The top bar contains four menus:
File: allow to load an input data file from FLSimulate or FLReconstruct, reload a previously loaded file (rewind), save individual events in XML file, load style file, quit the application.View: activate special display drivers (x3d, ROOT'S GL viewer), save images of the events,Options: focus on the event's region of interest (ROI, automatically computed), activate the rendering of some parts of the event models:- truth hits (from the
SDbank, - calibrated hits (from the
CDbank), - fitted tracks and reconstruction patterns (from reconstruction banks)...
- truth hits (from the
Misc.: additional options.
By default, FLVisualize starts with two panels, one (left) for the detector top view and the other (right) for a 3D rotating view.
The left panel allows to switch between top, side and front views thanks to radiobuttons at the bottom.
The right panel contains several pans:
Overview: display the 3D viewTracks: display a hierachy of the event data models with vertex, hits, tracks and other reconstruction data structures stored in the event model. Check boxes allow to make the corresponding graphics representations visible or not on the display.Options: proposes a set of additional display options (colors...)Selection: allows to select events given a set of cuts.
A bottom bar contains:
- a message log combo,
- an event number entry widget,
- a set of navigation buttons to loop on input events (forward/backward).
It is recommended to maximize the size of the FLVisualize's main window on your desktop.
Regarding event selection, the selection is done on data bank level. For instance, it is possible to select event by setting a range of run/event ids, a cut that operates on the event header bank. It is also possible to use homemade cuts by defining a cut manager file that holds several cut files. The cut manager file should look likes
where event_header_cuts.conf file can hold an event list id cut such as
Only events from run 0 and with event ids 3, 7, 15, 25 and 69 will be selected.
To make use of this cut, flvisualize program should be run with the --cut-config-file option set :
The additionnal --cut-config-file will enable the "Complex cut" widget and the list_of_ids_cut may be selected within the combo box.
Known Issues
Performance may be affected on slower systems or those without modern graphics cards due to the complexity of the geometry.
macOS systems may also see some performance loss on startup and moving between events.
Both issues are under investigation.